
Analytics of Things – AoT
According to IDC’s (International Data Corporation), the number of connected devices is projected to expand from 20 billion today to 30 billion by 2020 and to 80 billion by 2025. IDC also estimates that the amount of data created annually will reach 180 Zettabytes (180 trillion gigabytes) in 2025. Recent years, we have seen that more data helps to perform more innovative analysis and hence take better decisions.
On the other hand, if not visualized analyzed properly, this large amount of data may be distracting and misleading, that results in slow decision taking.
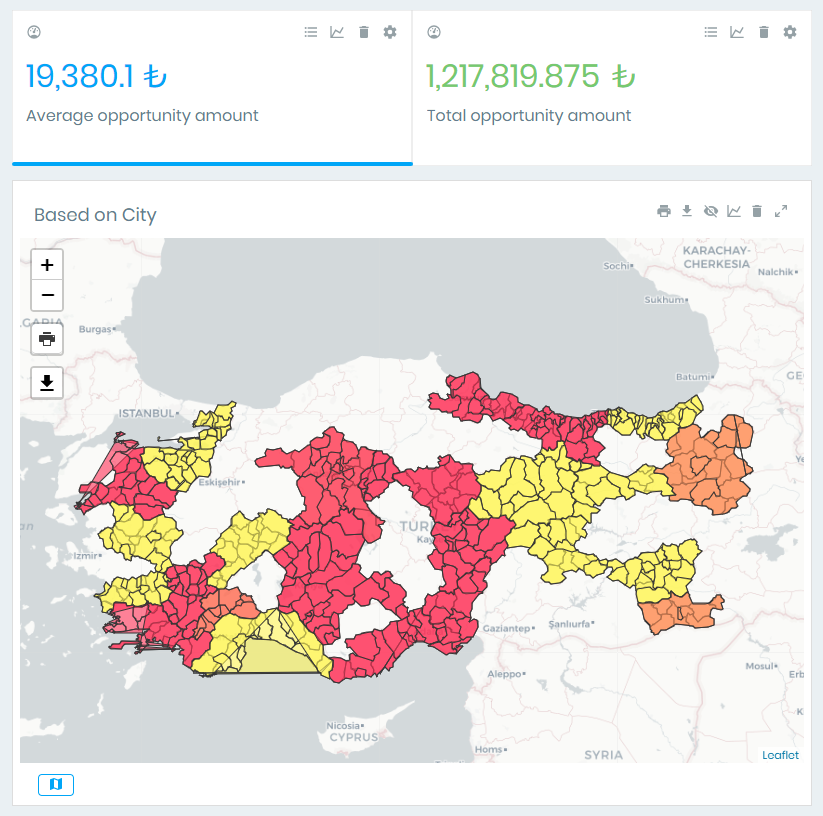
With mantIQ AoT interactive visualization tools, you can visualize your IoT data effectively and analyze better.
On the other hand, if not visualized analyzed properly, this large amount of data may be distracting and misleading, that results in slow decision taking.
With mantIQ AoT interactive visualization tools, you can visualize your IoT data effectively and analyze better.
Predictive Maintenance
Companies usually responds to IoT events (e.g. fault signal from a machine) reactively. However, predicting these types of events and taking the necessary measures beforehand will add great value to your company. With mantIQ company specific analysis mechanisms, you can decrease your intervention time to IoT events and increase customer satisfaction.
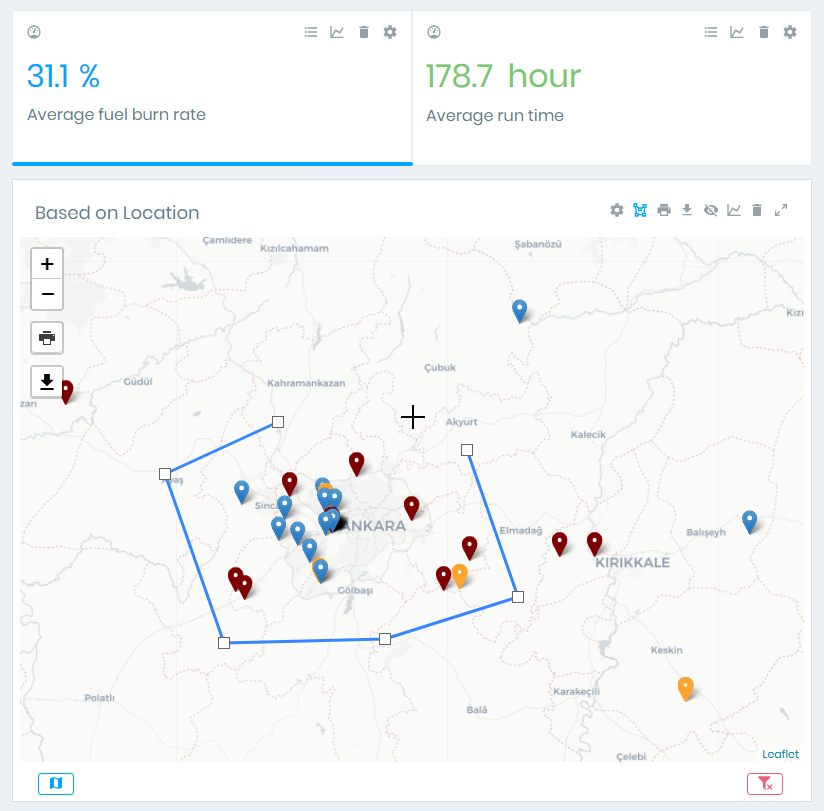
You can create a map-based Command and Control System that helps to monitor your customers’ IoT devices in a very short time. In this way, you can make your predictive maintenance service more effective, which enables to take new opportunities.
You can create a map-based Command and Control System that helps to monitor your customers’ IoT devices in a very short time. In this way, you can make your predictive maintenance service more effective, which enables to take new opportunities.
Easy Integration to Legacy Systems
The user interfaces of your legacy systems or traditional off-the-shelf business intelligence products may not satisfy your requirements. As changing those systems according to your needs is not possible, you may be analyzing your IoT data manually with traditional office software tools. mantIQ is the business intelligence software you need. We can prepare any type of visualization mechanism on top of your IoT data, in this way the interpretation will be a trivial task for you.
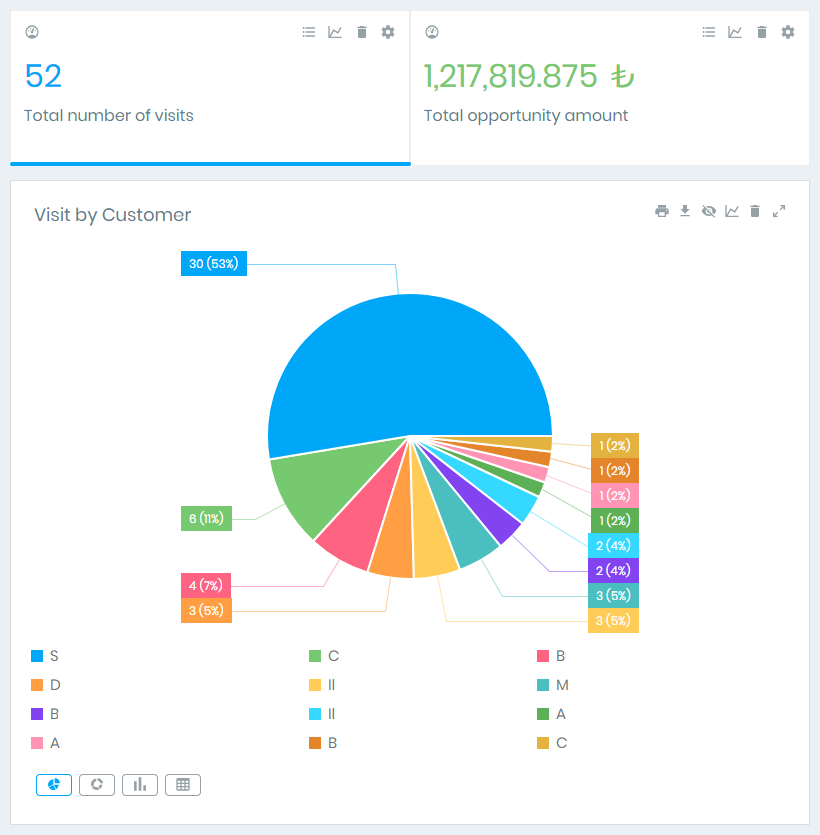
With extensive integration capability, mantIQ can retrieve data from any type of data source. You can examine your IoT data in detail, share your analysis with your colleagues and reach those analysis 7/24 through Web-based interactive graphical interfaces. Furthermore, through advanced reporting tools, you can export your analysis graphs to any format (e.g. PDF) you desire easily.
With extensive integration capability, mantIQ can retrieve data from any type of data source. You can examine your IoT data in detail, share your analysis with your colleagues and reach those analysis 7/24 through Web-based interactive graphical interfaces. Furthermore, through advanced reporting tools, you can export your analysis graphs to any format (e.g. PDF) you desire easily.
Smart Monitoring with Artificial Intelligence
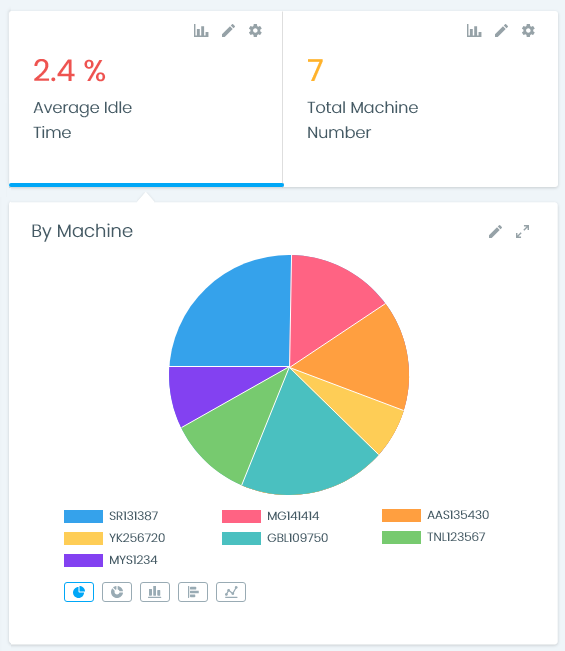
mantIQ is not just another visualization tool. Through its machine learning tools, you can examine your past data and identify the main parameters which causes an event in interest. You can then use these parameters on the definition of situational awareness rules to be run on real-time IoT data. After that, when similar situations are identified in the future, corresponding notifications are sent to authorized people. With mantIQ rule engine, you can transfer business intelligence learned from past data.