mantIQ for Finance
Financial status analysis in institutions is very important for managers and decision makers in terms of analyzing current status and making prudential decisions. Usually, financial analysis is a troublesome process that require to collect various data from various sources and to interpret them. Particularly, if there are multiple units in the institution providing wide range of services, consolidation of financial data becomes harder. The goal of mantIQ is to facilitate this challenging process for managers and decision makers in a way that they can perform these tasks easily in their daily routines.
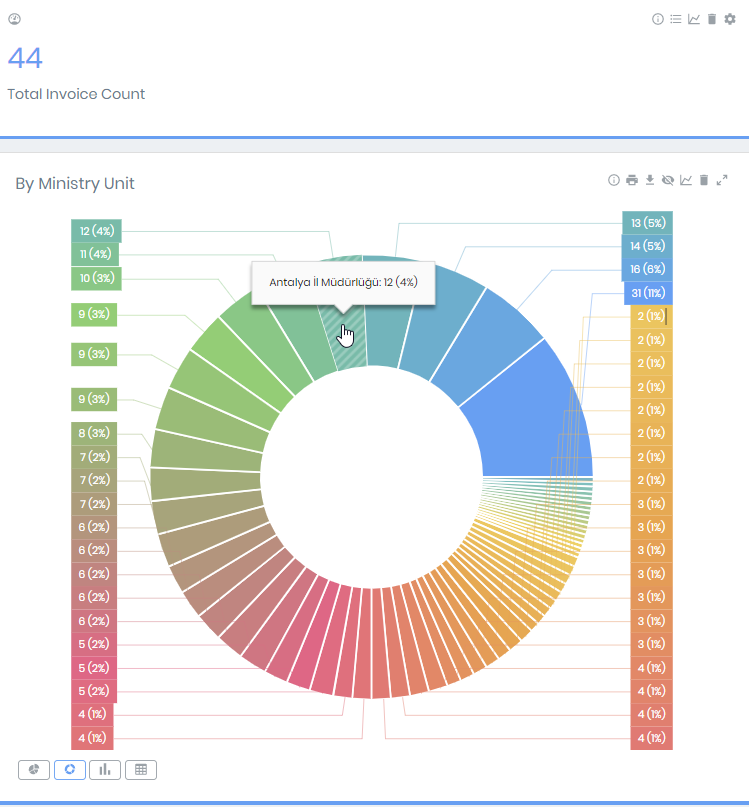
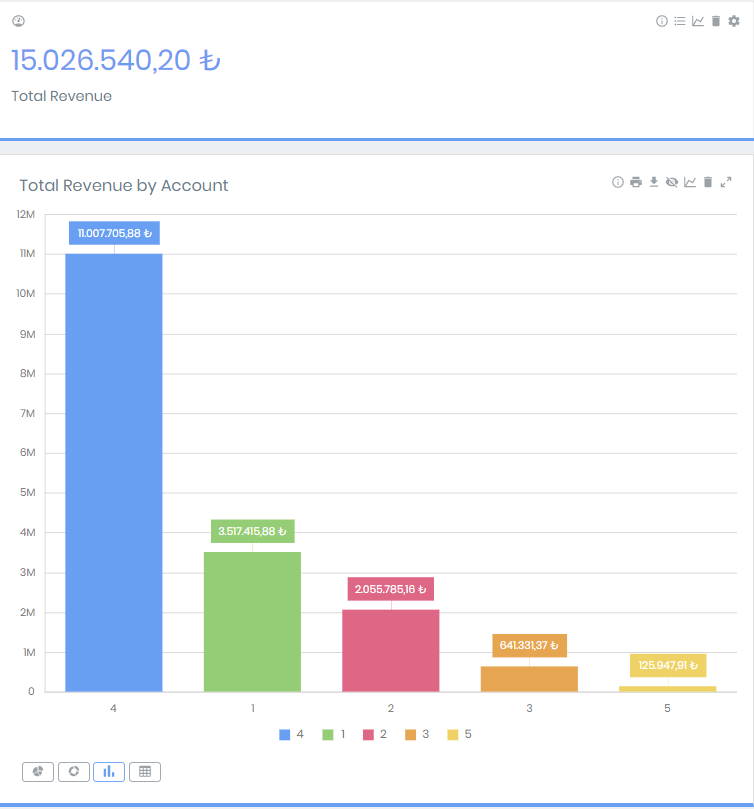
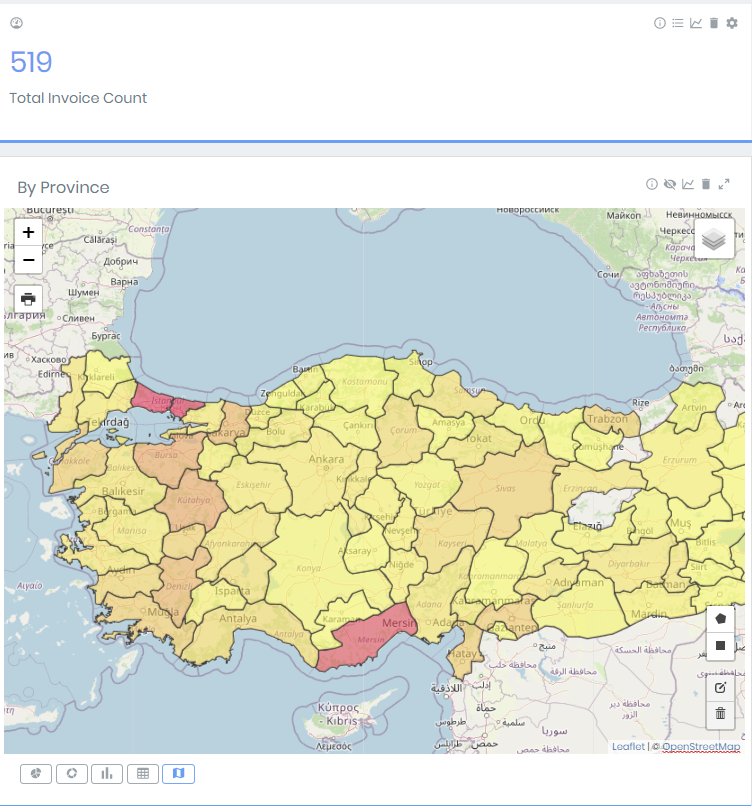
A wide variety of Indicators are provided by mantIQ to make meaningful and detailed analysis of most financial data including cost analysis, budget revenue/expense balance and billing details. A heat map visualizing 'By Province' Dimension of the Indicator named 'Total Invoice Count’ is presented on the right. Same Indicator might be utilized with different Dimensions based on institution needs such as 'By Unit', 'By Service Type', 'By Department' and these Dimensions can be dynamically visualized with several graphical charts.
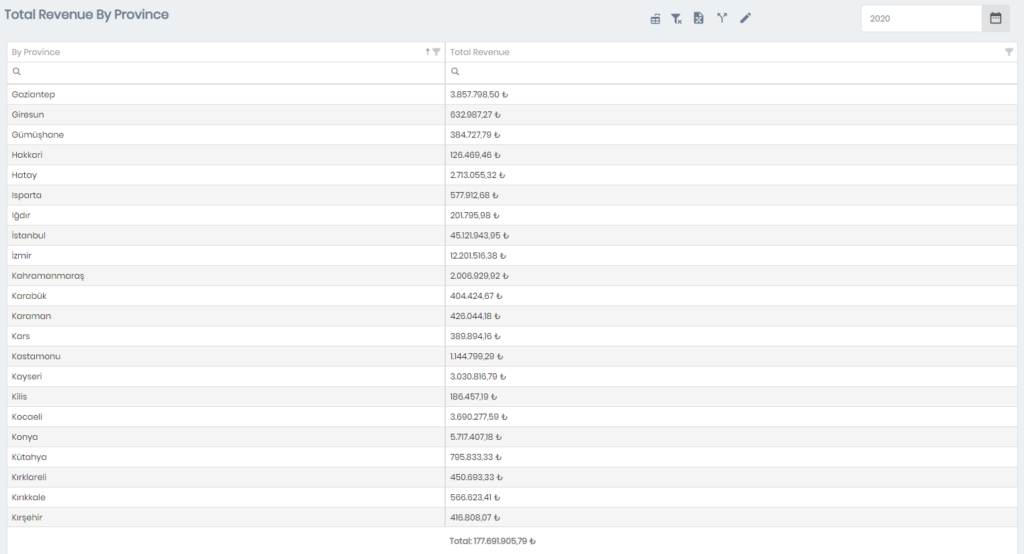
Periodic financial reporting is a very time and effort consuming task for most institutions. A table with monthly periods of 'By Province’ Dimension of the Indicator named 'Total Revenue' is shown on the right. Using mantIQ, any identified Indicators and Dimensions can be analyzed with desired periods in real-time and it can be reported with institution-specific templates in Word, Excel or PowerPoint formats.